In this blog post, we will learn how to perform 1D measurements using MVTec HALCON and Bottlenose. After we explained
how to calibrate Bottlenose using HALCON in our previous blog post and provided a hands-on guide in this post, we will
now focus on how to perform 1D measurements using Bottlenose and HALCON.
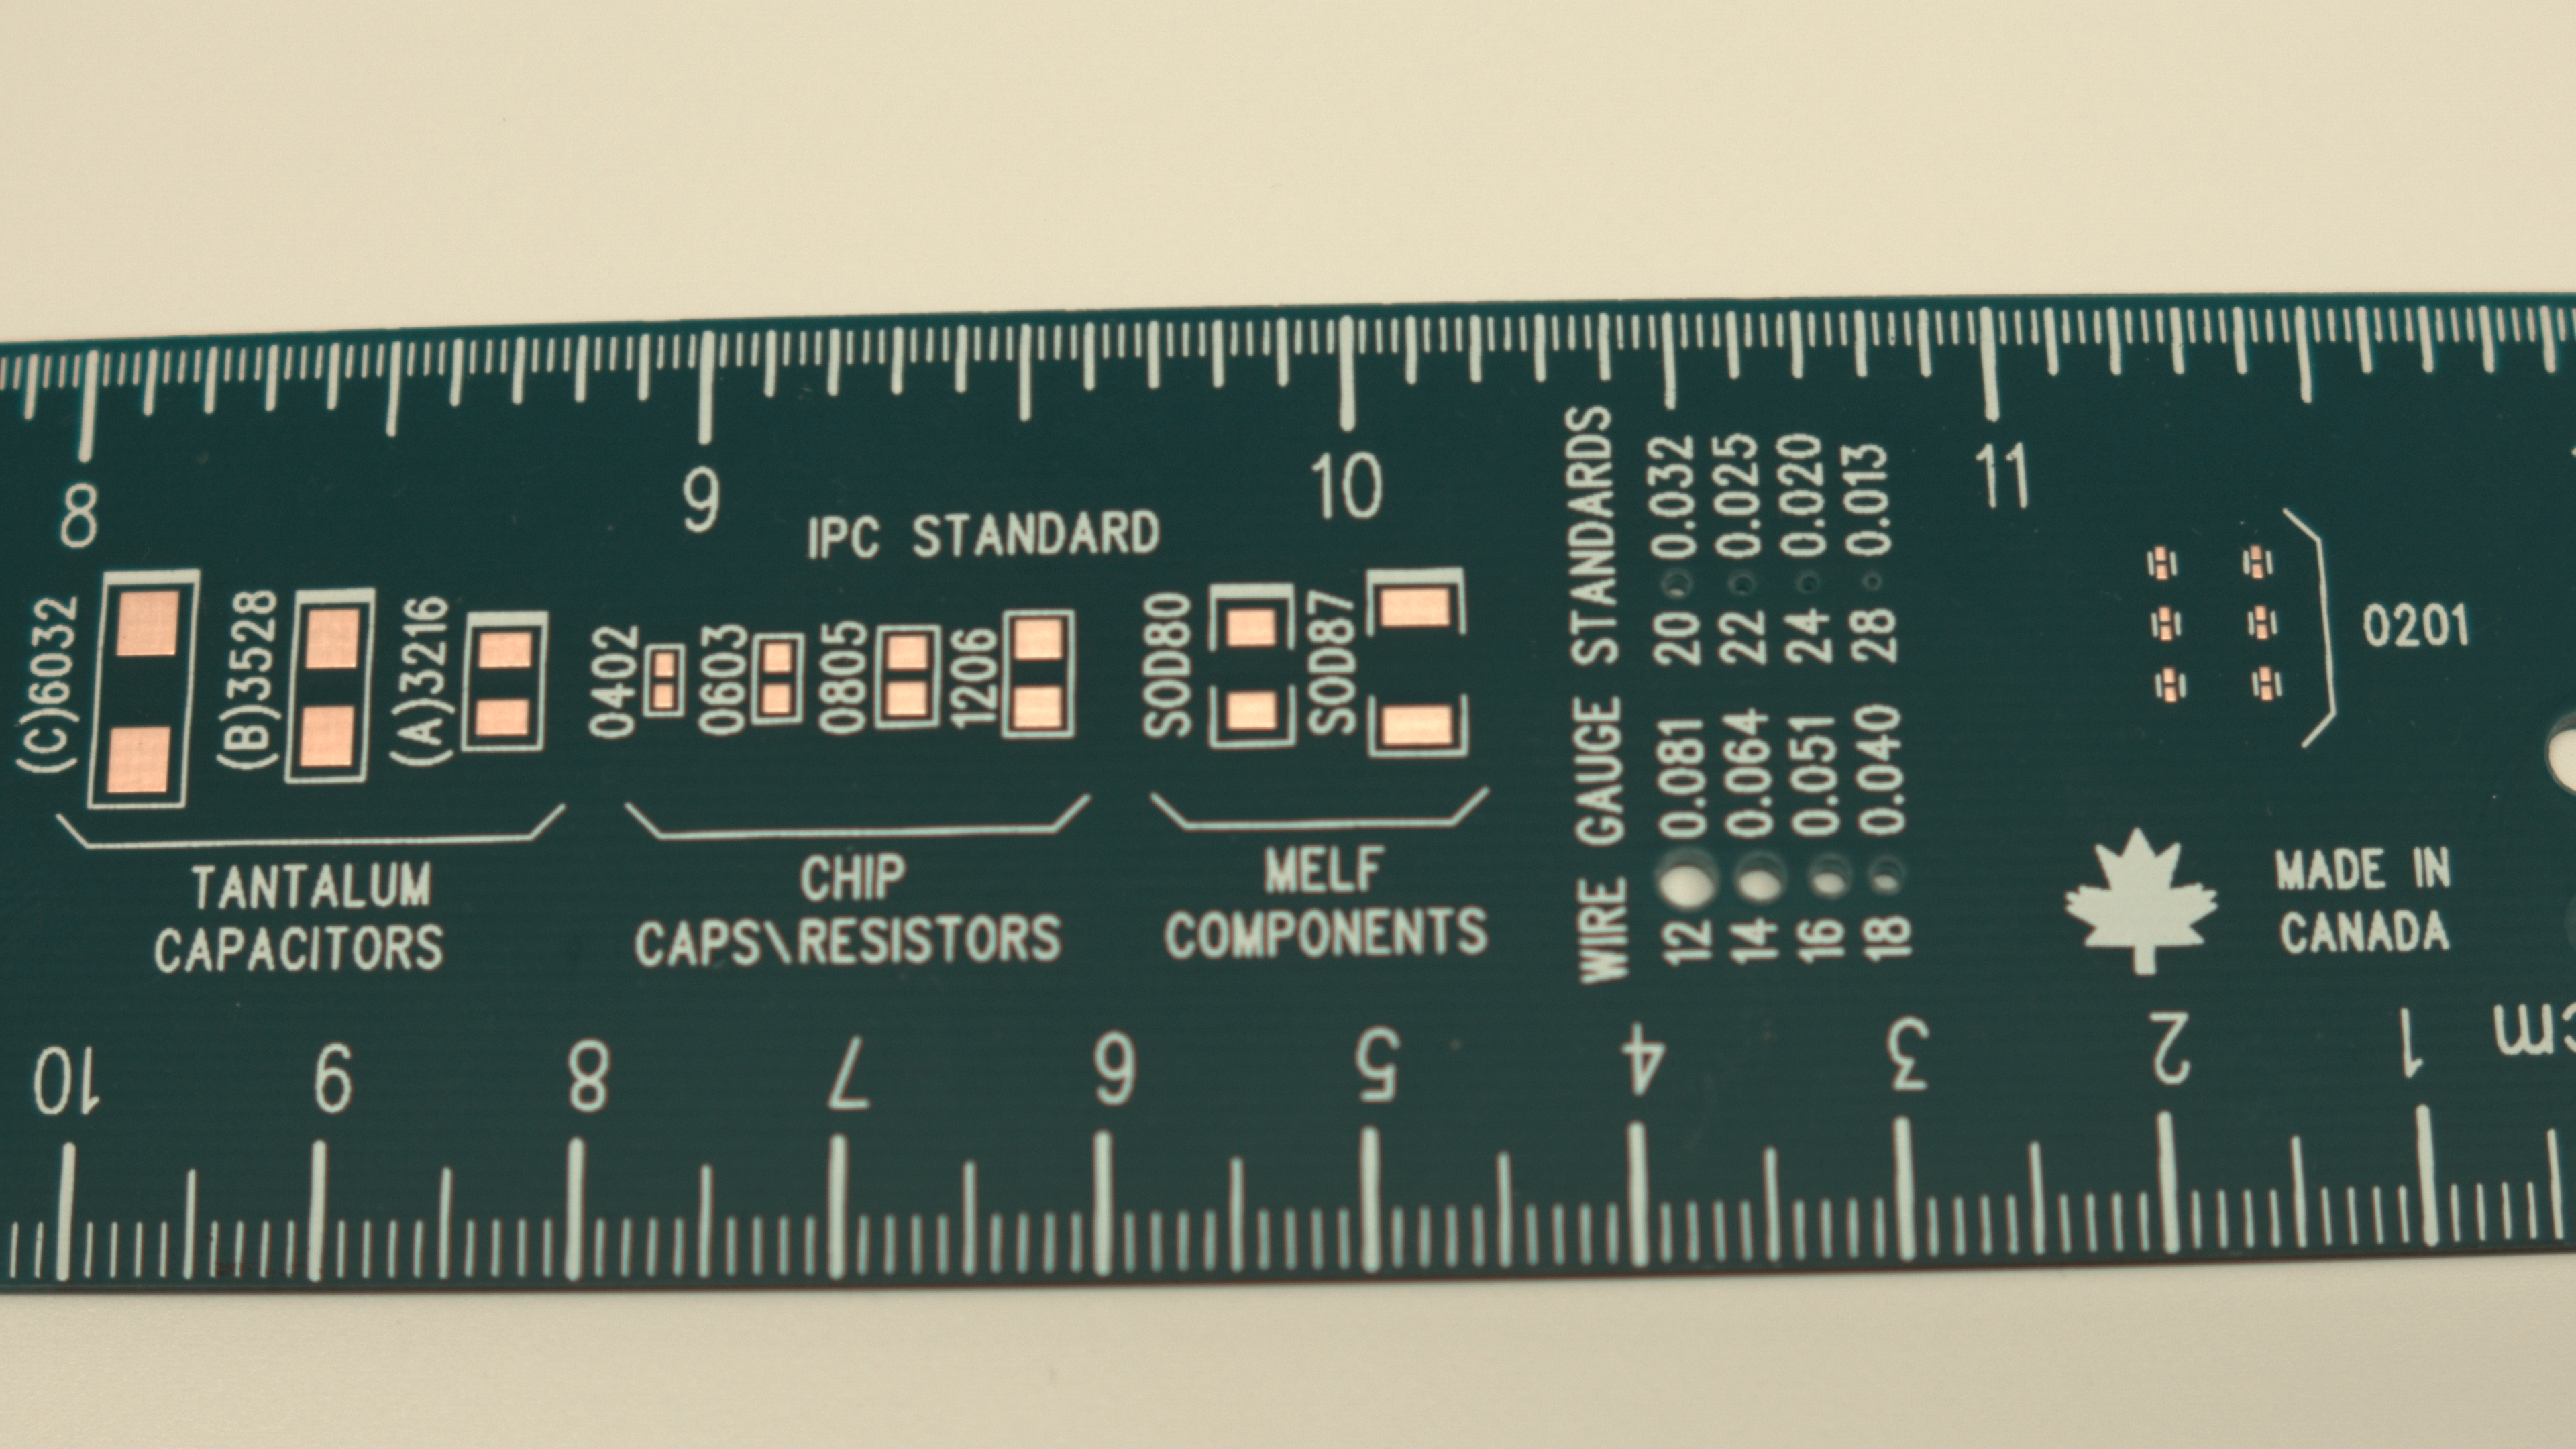
1D measurements are a common task in machine vision applications. They are used to measure the length and orientation
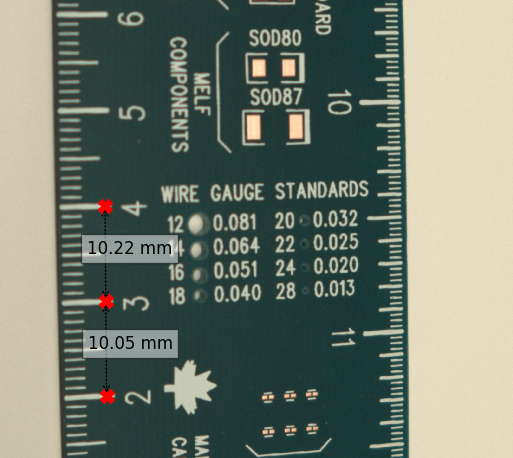
of lines and edges in an image. A simple application is measuring the distance between lines in an image. Above is a
crop of a sample image of a ruler that was taken with a Bottlenose camera. If we want to measure the distance between
the major lines (i.e. centimetres), we can measure them along a known line.
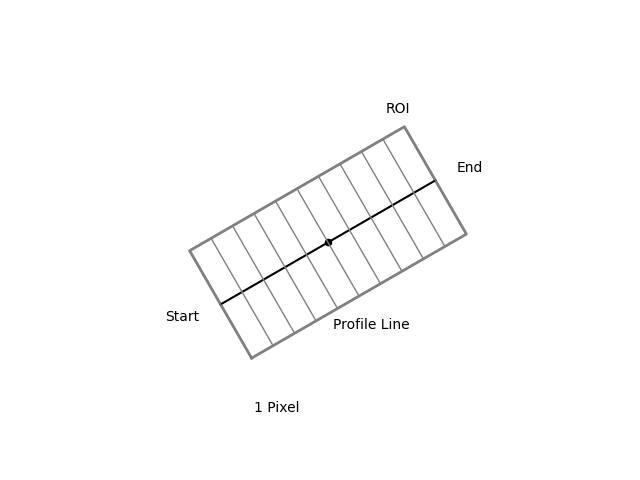
The HALCON function gen_measure_rectangle2 generates the rectangle of a given size and orientation at a given position.
The measurement can be sampled from this rectangle. HALCON supports other operators to extract such measurements too.
Conceptually they follow a predefined path to extract the measurement, as shown in the following image. The measurement
rectangle is also annotated in red in the above image.
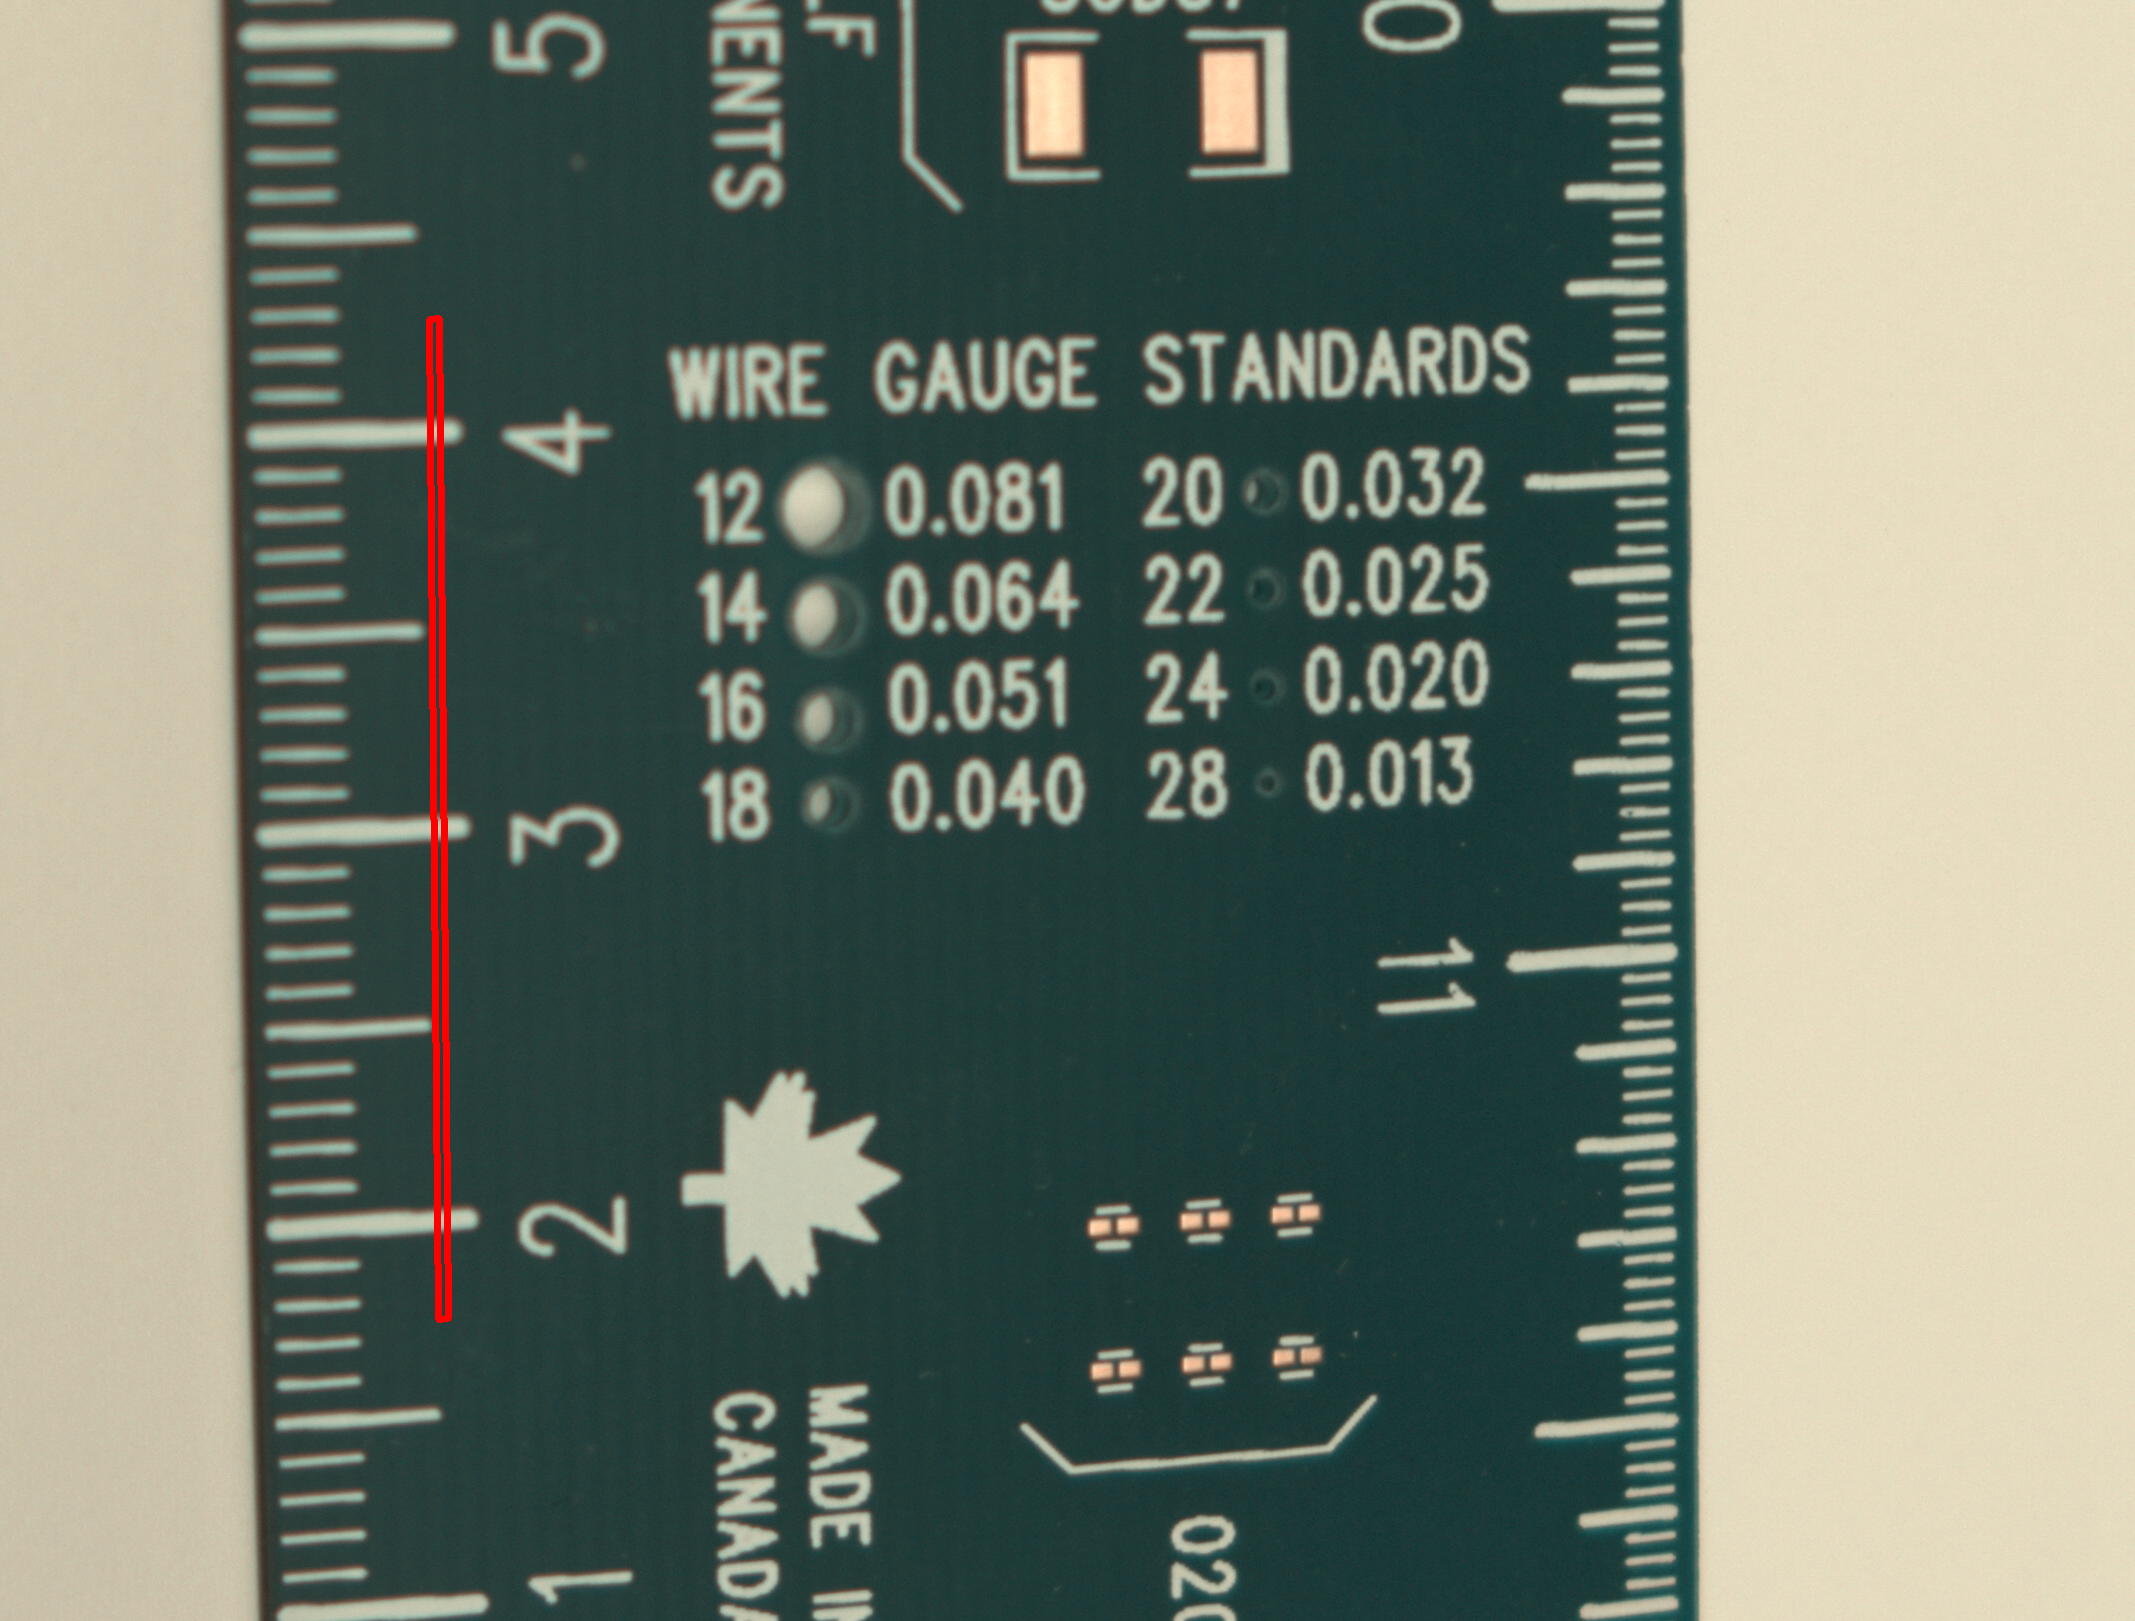
With measure_projection we can then measure the gray-value profile along the line. We could naively try to threshold the
grey values for the ruler and then measure the distance between the two valleys. However, this approach is not robust
and will fail if the lighting conditions change. Instead, we compute the first and second derivative of the profile
and then search for the zero crossings of the first derivative and crosscheck this with the second derivative. This
approach is more robust and works better than simple thresholding.
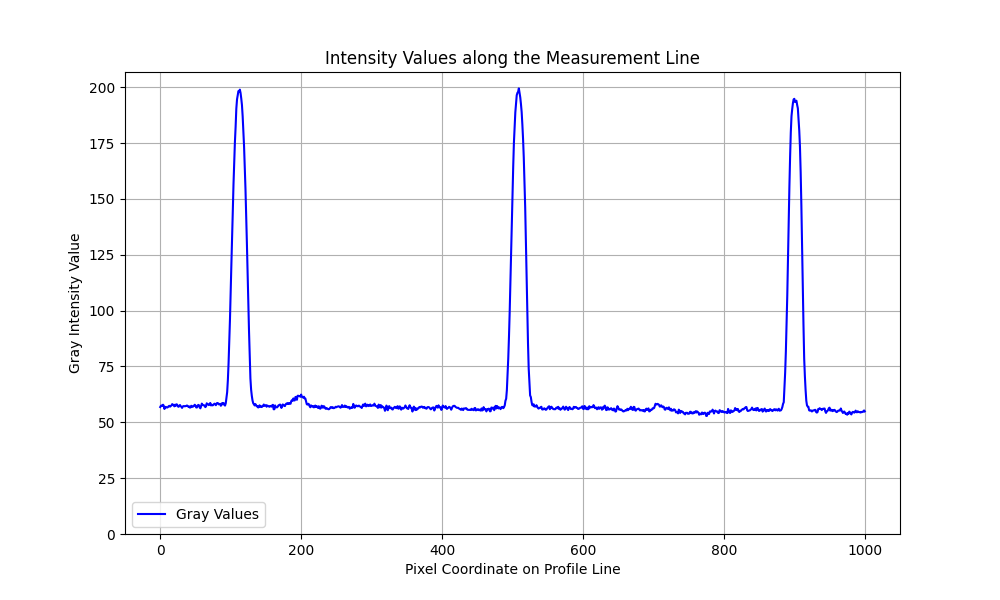
Below is the gray profile of the profile shown in red from the image above. The peaks in grey intensity highlight
the divisions.
Below we show a Figure that shows the first and second derivative of the smoothed gray profile. The vertical dashed
lines indicate the zero-crossings in the second derivative, where the threshold (horizontal dashed line) is breached.
These pixel coordinates on the profile line then indicate the centimetre marks on the ruler.
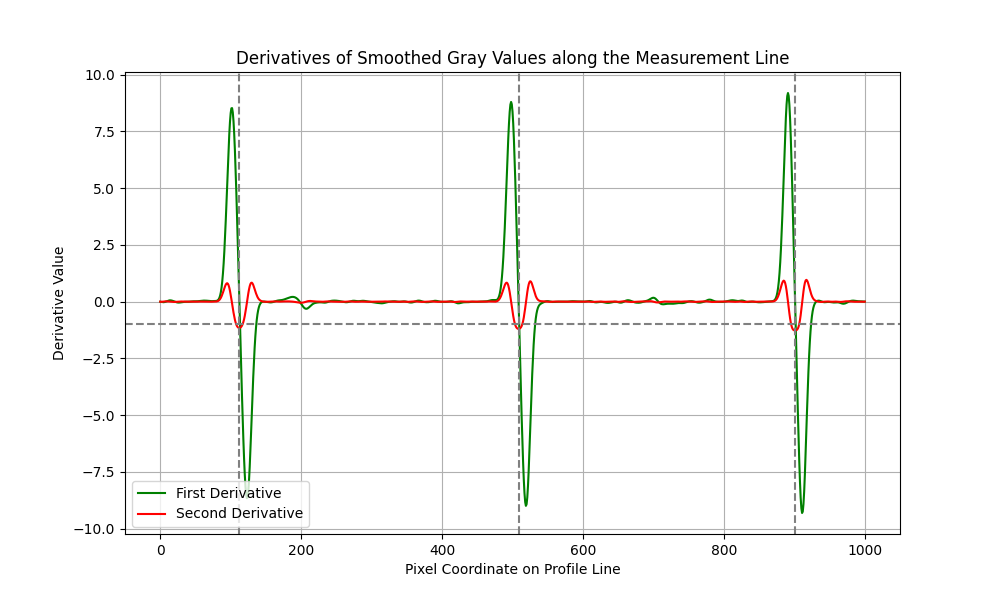
As seen the zero-crossings of the 10 mm lines are clearly visible. With fine-tuning the thresholding one can get the
exact position of the major centimetre lines. Given the calibration parameters obtained in the previous blog post, we
can now perform metric measurements with sub 0.2 mm accuracy. As shown in the image below.
Cross-posted from my company blog.
Published: 2024-06-06
Updated : 2025-10-04
Not a spam bot? Want to leave comments or provide editorial guidance? Please click any
of the social links below and make an effort to connect. I promise I read all messages and
will respond at my choosing.